
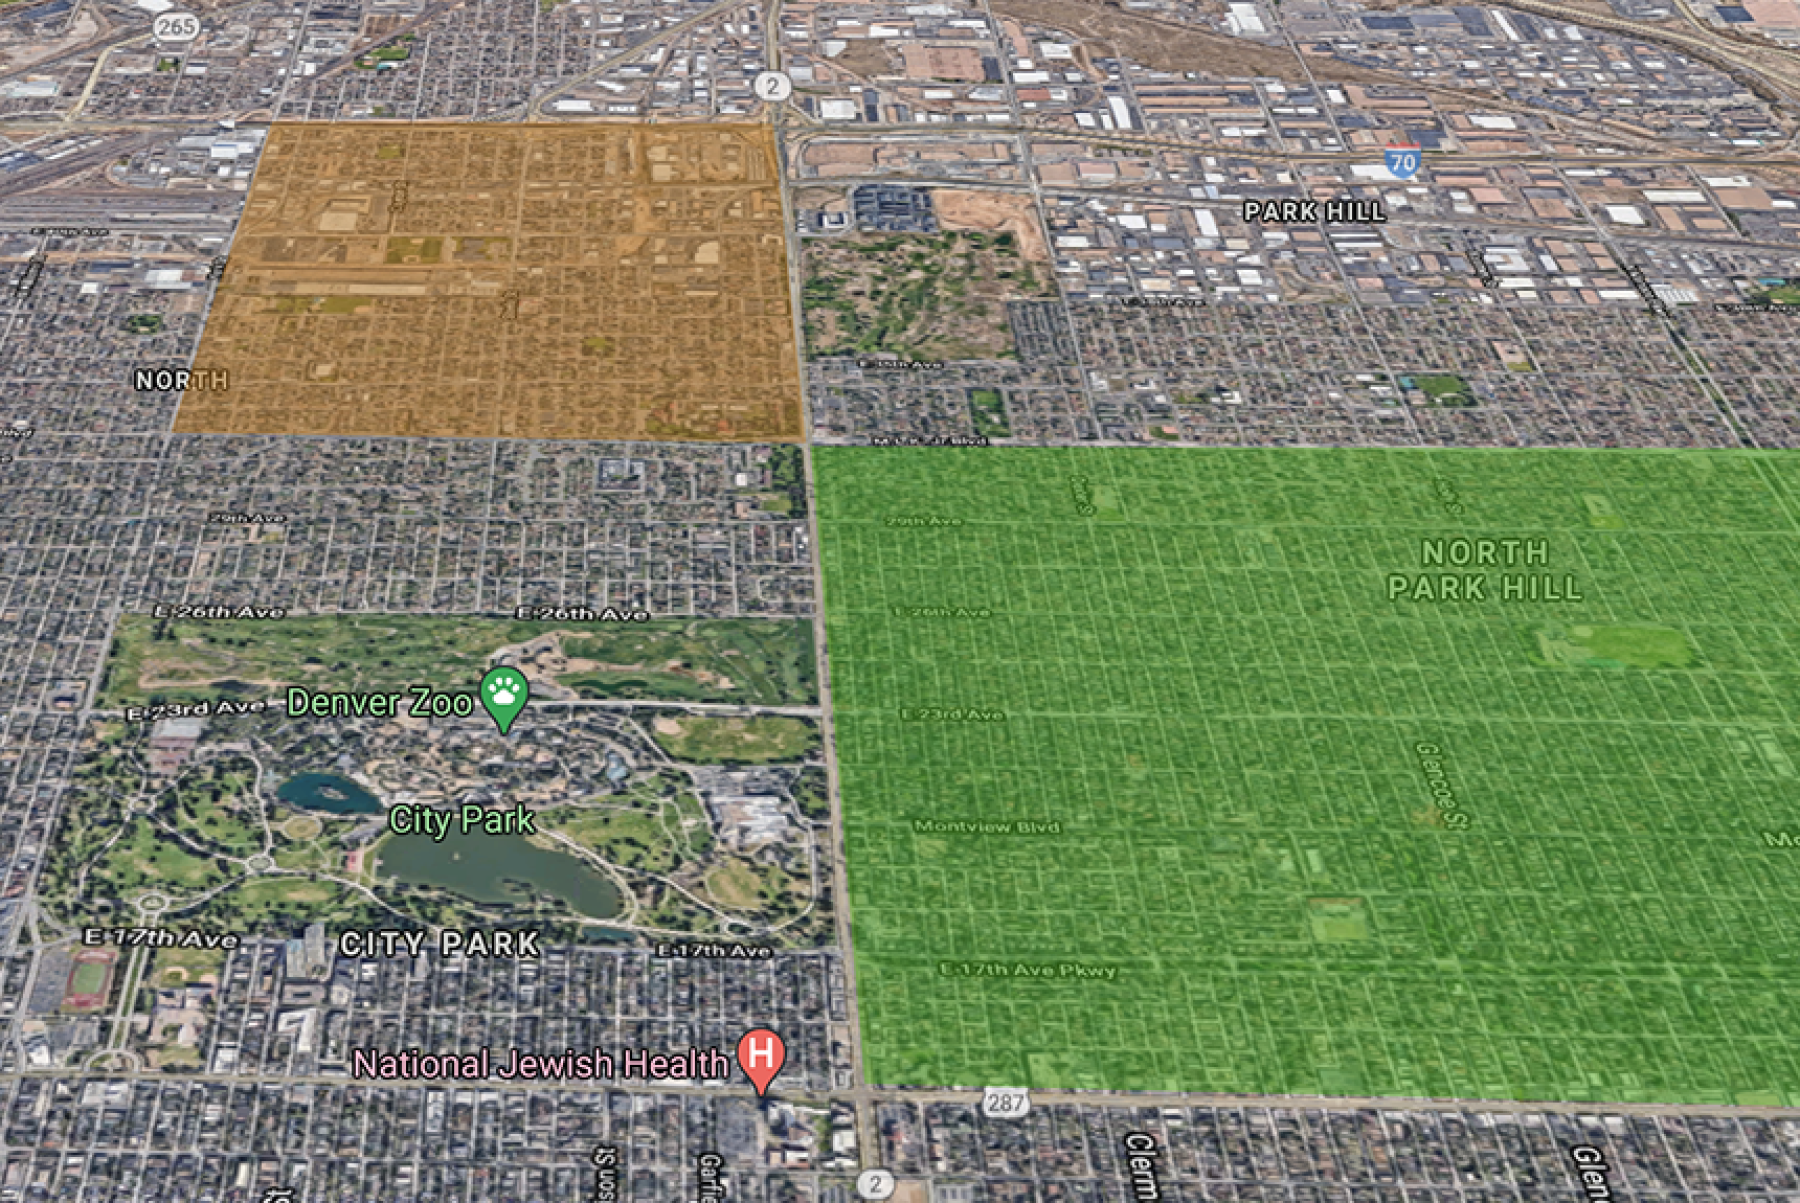
In Denver’s well-to-do North Park Hill neighborhood, more than half the residents between 30 and 40 years old have received at least their first dose of the COVID-19 vaccine. But just across Colorado Boulevard in the Clayton neighborhood, less than half of people age 70 or older — a higher priority group — have started their vaccines.
We know this thanks to new maps from the Metro Denver Partnership for Health (MDPH), with leadership from Denver Public Health. The maps are published on CHI’s website.
These census and ZIP code maps show how vaccines are distributed across the metro region. Importantly, they can reveal where there are under-vaccinated neighborhoods and populations so health care providers and community leaders can work in tandem to distribute the vaccine to those most in need. The interactive maps are updated weekly based on data from the Colorado Immunization Information System.
Maps in Action
Health care partners can use these maps to identify and prioritize neighborhoods for outreach or assistance with registration and scheduling. And by overlaying other maps such as CHI’s Social Distancing Index, we gain a better picture of the pandemic response and those most affected. For example, vaccine planners should analyze if lower vaccination rates correlate with poverty or census tracts that have higher percentages of people of color.
Dr. Judy Shlay, Associate Director of Denver Public Health, a department of Denver Health, is working to ensure equity is at the center of the COVID-19 response work. She told CHI, “There continues to be challenges in reaching communities that have high COVID rates and low vaccination uptake. … For us working in public health, we know which communities have been disproportionally affected by COVID, and they are the same communities which are not at the appropriate level of vaccine coverage.”
For example, as of March 18, the vaccination maps show that only 46% of adults 70 years and older in Aurora’s Montview Park had received their COVID-19 vaccine. Montview Park is west of the Anschutz Medical Campus and only a few blocks south of Central Park, where 100% of 70+ adults have received their vaccine. This gap is even more concerning in light of CHI’s Social Distancing Index, which reveals that 61% of Montview Park residents are living with incomes at or below 200% of the federal poverty level, compared to 16% of Central Park residents.
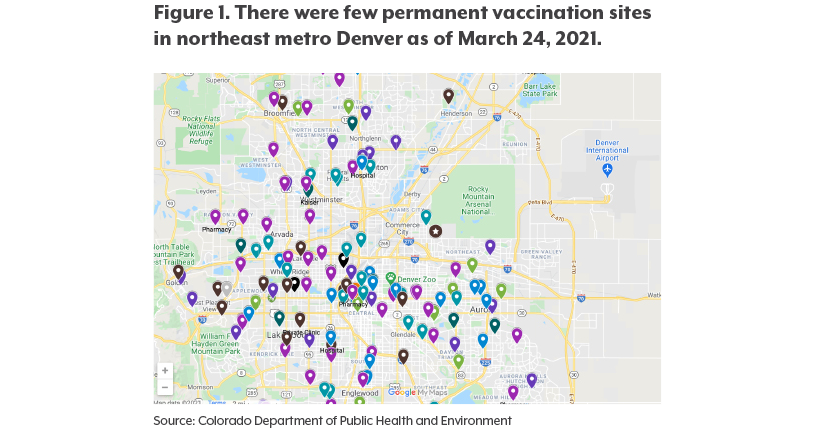
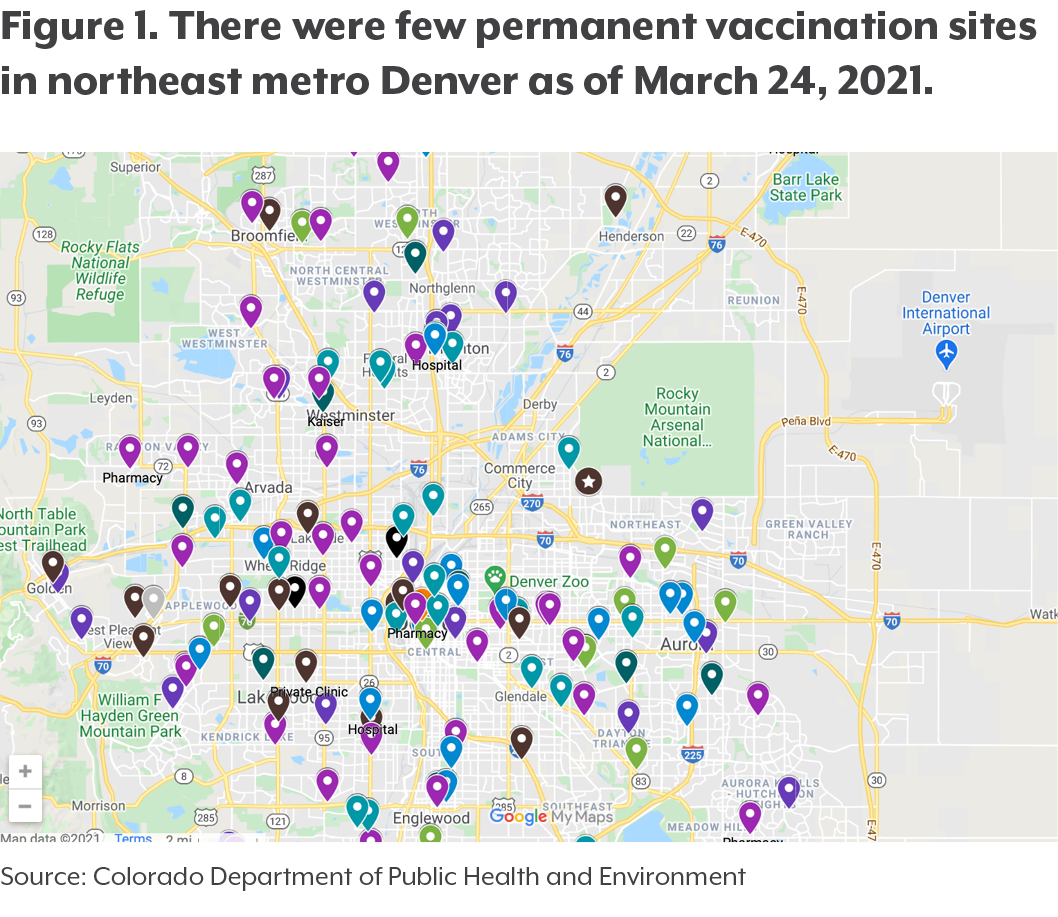
These data can also help public health and health care systems understand where to set up long-term clinic sites, which can help build trust with the community. The state could prioritize supply to pharmacies in under-vaccinated neighborhoods with high case rates or overlap these data with COVID-19 vaccine provider maps to understand where vaccine deserts are. (See Figure 1.) One win is that 73% of adults 70 and older in Denver’s Elyria-Swansea neighborhood are vaccinated as of March 18. Although not 100%, this information is powerful considering this neighborhood is considered a vaccine and food desert.