Children’s Access to Care Index Data Sources and Methods
The Children’s Access to Care Index is based on five data sources outlined below. All data are for children between the ages of 0 and 18 years old unless noted otherwise. More information about each data source can be found by following the links in the box on the last page.
Colorado Health Access Survey (CHAS)
What It Is: The Colorado Health Access Survey – the CHAS – is the premier source of information on health insurance coverage, access to health care, and how health care is used in Colorado. More than 10,000 randomly selected households participated in the 20-minute survey. The data are statistically weighted to be representative of the state’s population. The CHAS is fielded, analyzed and managed by the Colorado Health Institute. It is funded by The Colorado Trust.
Time Points: Data from 2009, 2011, 2013 and 2015 were used.
CHAS Metrics Used:
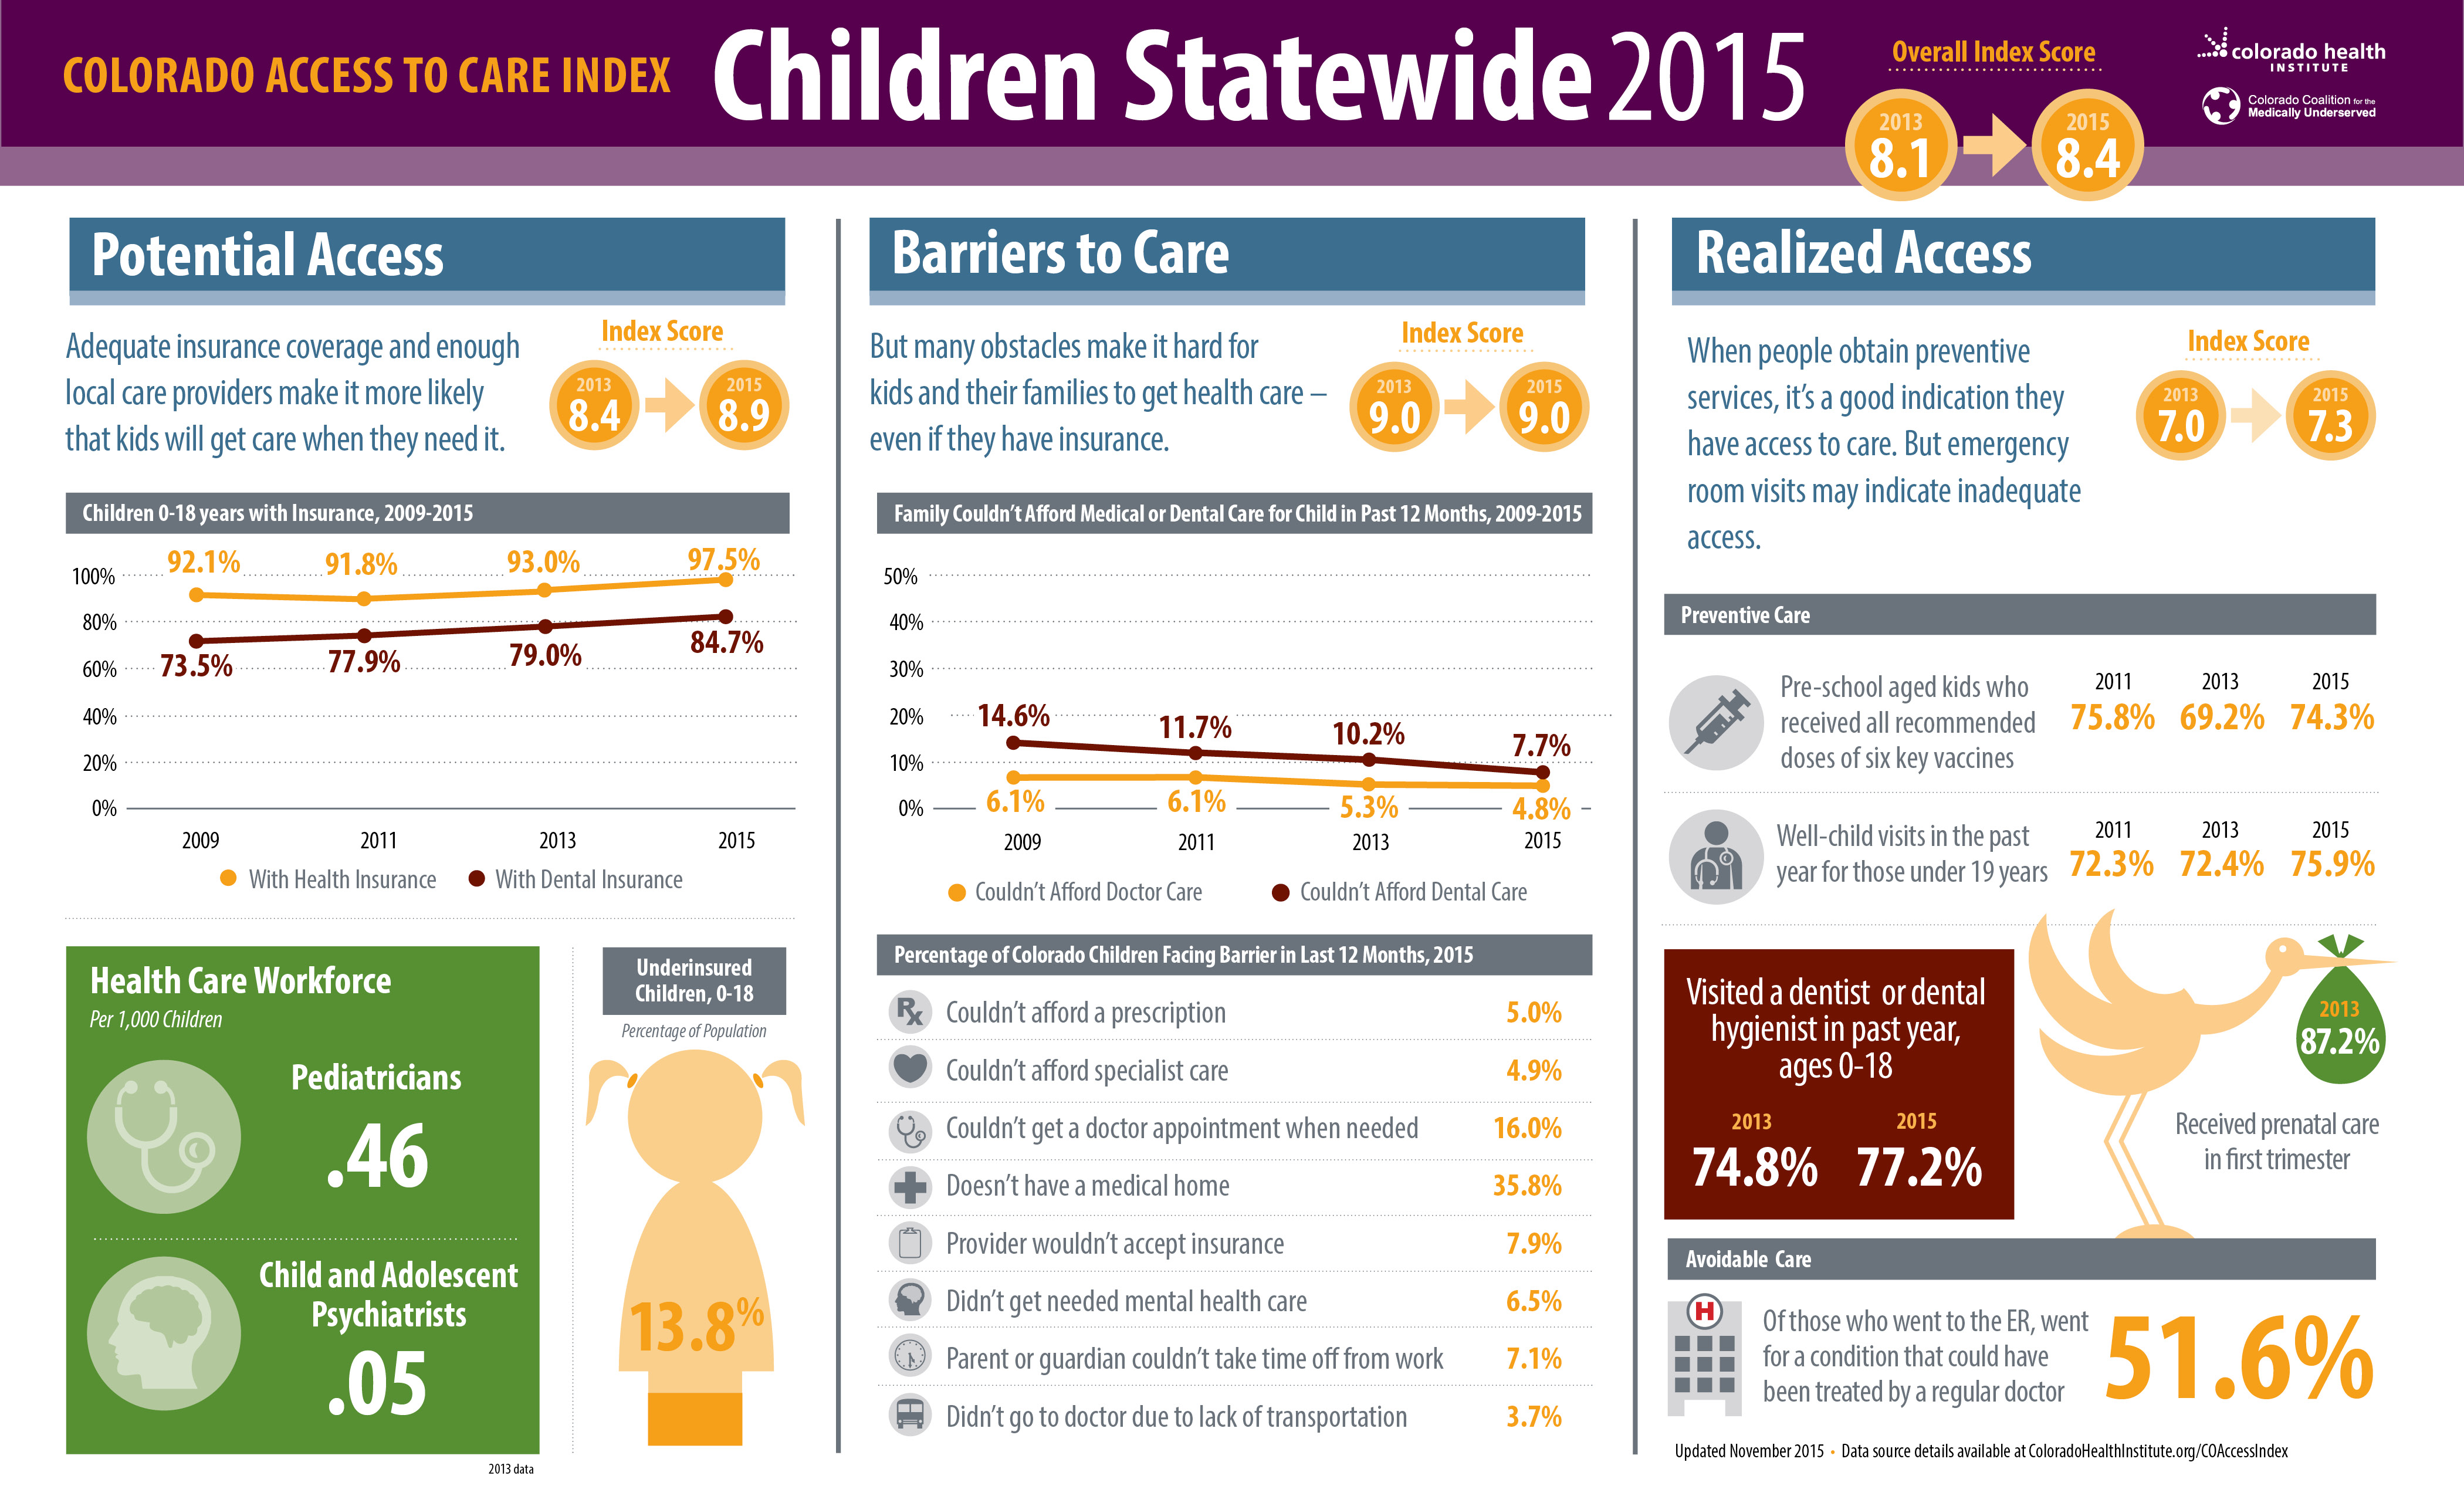
Potential Access
• Children with or without health insurance at the time of the survey.
• Children who are adequately insured or underinsured for medical care in the past 12 months
• The CHAS defines underinsurance for families earning at least 200 percent of the federal poverty level (FPL) as spending as least 10 percent of annual income on out-of-pocket medical expenses, not including the cost of purchasing health insurance. For families below 200 percent FPL, underinsurance is defined as spending at least five percent of annual income on out-of-pocket medical expenses
• The CHAS defines adequately insured as those who had coverage for all of the 12 months prior to the survey, did not meet either of the two out-of-pocket cost definitions of underinsurance, and did not have an uninsured family member.
• Children with or without dental insurance at the time of the survey.
Barriers to Care
Percentage of Colorado Children Facing Barrier in Last 12 Months.
• Did not get needed doctor care due to cost. • Did not fill a prescription due to cost.
• Did not get needed specialist care due to cost.
• Did not get needed dental care due to cost.
• Unable to get an appointment at the doctor’s office as soon as you thought one was needed
• Unable to find transportation to the doctor’s office or the doctor’s office was too far away.*
• Parent told by the doctor’s office they weren’t accepting patients with child’s type of health insurance.
• Needed mental health care or counseling but didn’t get it at that time (for those between the ages of 5 and 18 years old).*
• Unable to get care because parent or guardian could not take time off of work*
• Parent or guardian did not seek an appointment for the child because child was uninsured.*
* Asked for the first time in 2013.
Realized Access
• Visited a dentist or dental hygienist in the past 12 months.
• Had a well-child visit (visit for a check-up, physical examination or other preventive care) in the past 12 months.
• Of children who visited a hospital emergency room in the past 12 months, those who went for a condition that could have been treated by a regular doctor if one had been available.
Notes and Limitations:
• The Colorado Health Access Survey is conducted every other year. The complete survey form is available here.
• The “Parent or guardian did not seek an appointment for the child because child was uninsured” indicator should be interpreted with caution. Because the denominator – the number of uninsured children – has become smaller after the implementation of the Affordable Care Act (ACA). The estimate has a larger margin of error.
What It Is: A database of practicing providers across Colorado.
Time Points: MedicalQuest data from 2013 were used for the Children’s Access to Care Index.
MedicalQuest Metrics Used:
Potential Access (number of)
• Pediatricians
• Child and adolescent psychiatrists
Notes and Limitations:
MedicalQuest provides an estimate of practicing providers. The Colorado Health Institute calculated rates of providers per 1,000 children between the ages of 0 and 18 years old using MedicalQuest data and state population estimates from the Colorado Demography Office.
Due to changes in MedicalQuest data collection methodology, 2015 data were not available at the time of the children’s index release. Because we do not anticipate major changes in the workforce between 2013 and 2015, we felt it was reasonable to hold these data points constant at 2013 values for the 2015 time period.
In order to calculate a score for the workforce indicators we compared Colorado provider to population ratios to the Solucient published benchmark, which can be found here.
What It Is: The Colorado Child Health Survey is an annual survey of 1,000 children between the ages of 1 and 14 years old. The survey contacts parents of young children who responded to The Behavioral Risk Factor Surveillance System (BRFSS) and indicated they would be willing to complete the Child Health Survey. The survey covers a range of topics including physical activity, nutrition, access to health and dental care, behavioral health and others. The survey is administered by the Colorado Department of Public Health and Environment and was initiated in 2004.
Time Points: Child Health Survey data from 2011, 2013 and 2014 were used in the Children’s Access to Care Index.
Child Health Survey Metrics Used:
Barriers to Care
• Does not have a medical home
• A child is considered to not have a medical home if the answer is ‘no’ to any of the following questions:
Does the child have a personal doctor or nurse? Is getting needed referrals for the child a problem?
Does the child have a usual source of sick and well care? Did the child receive all care coordination needed?
Does the child have family centered care?
Notes and Limitations:
The Child Health Survey only includes children between the ages of 1 and 14 years old, as opposed to the majority of other indicators which include children up to 18 years old. The Children’s Index uses 2014 data in the 2015 time period because it is the most recent data available. Weighted frequencies are not available.
National Immunization Survey
What It Is: The National Immunization Survey is used to monitor vaccination coverage among children 19-35 months old. Landlines and cell phones are randomly selected and called to enroll one or more age- eligible child into the survey. The survey is administered annually by the National Center for Immunizations and Respiratory Diseases (NCIRD) of the Centers for Disease Control and Prevention (CDC).
Time Points: National Immunization Survey data from 2009, 2011, 2013 and 2014 were used in the Children’s Access to Care Index.
National Immunization Survey Metrics Used:
Realized Access:
• Pre-school aged children (19-35 months old) that received all recommended doses of six key vaccines.
• The recommended vaccination series 4:3:1:3:3:1 includes four or more doses of diphtheria, tetanus and pertussis; three or more doses of poliovirus vaccine; one or more doses of any measlescontaining vaccine; three or more doses of Haemophilus influenzae type b (Hib) vaccine; three or more doses of hepatitis B vaccine; and one or more doses of varicella.
Notes and Limitations:
The Children’s index uses 2014 data in the 2015 time period because it is the most recent available data. Weighted frequencies are not available.
What It Is: The PRAMS is an annual survey funded by the Centers for Disease Control and Prevention (CDC) and administered by the Colorado Department of Public Health and Environment (CDPHE). The PRAMS is designed to monitor the experiences of Colorado women before, during and after birth. The survey is mailed to a sample of women who have recently given birth. The survey data are weighted to be representative of Colorado’s population of women who recently gave birth.
Time Points: The Colorado Access to Care Index used 2009, 2010 and 2011 data for the 2011 indicator. The 2013 metric used data from 2011, 2012 and 2013.
PRAMS Metric Used:
Realized Access
• Mother received prenatal care in first trimester of pregnancy Notes and Limitations: Due to the small sample size of the PRAMS, we averaged three years of data to calculate stable estimates.
The 2013 and 2015 Children’s Index score are both based off of the 2013 data point.
Colorado Access to Care Index Methods
Selection of Metrics
The following criteria were used to select the metrics included in the Colorado Access to Care Index:
• Validity: Metrics of factors known to increase potential access to care, barriers to care identified by consumers, and services used that suggest adequate access or insufficient access to primary care.
• Subgroups: Metrics that demonstrate access to care for Coloradans with all kinds of insurance, in regions across the state, belonging to different racial and ethnic groups and at different income levels. Some metrics are only available for, or only applicable to, particular age groups.
• Available over time: Metrics that allow the index to be updated and show changes over time. Most data sources included are expected to be available in the future, although not all are available retrospectively.
Notes and Limitations:
• The Children’s Access to Care Index assumes that all metrics are equally important. We did not weight some metrics higher than others.
• Under Barriers to Care, the CHAS metric “Didn’t seek care because uninsured” was not included in the calculation of the index because its denominator — or population on which it is based — is limited to only uninsured children. This denominator has changed significantly over time with health coverage expansions under the ACA.
• We did not include some years of data for some metrics due to unavailability or a change in definitions that would compromise the comparability of the data across years.
Questions about the Colorado Access to Care Index may be directed to Jeff Bontrager at bontragerj@coloradohealthinstitute.org.