
The rate of food insecurity jumped more than three percentage points since 2021 to 11.2% in 2023.
Since 2019, the CHAS has asked people if they ever ate less than they thought they should in the past year because they couldn’t afford food. The results follow a similar pattern as the housing instability questions. There was a dip in 2021 that coincided with a flood of pandemic aid. An increase in food insecurity followed in 2023, after pandemic aid had mostly expired. At the same time, the price of food rose sharply around the time of the survey.
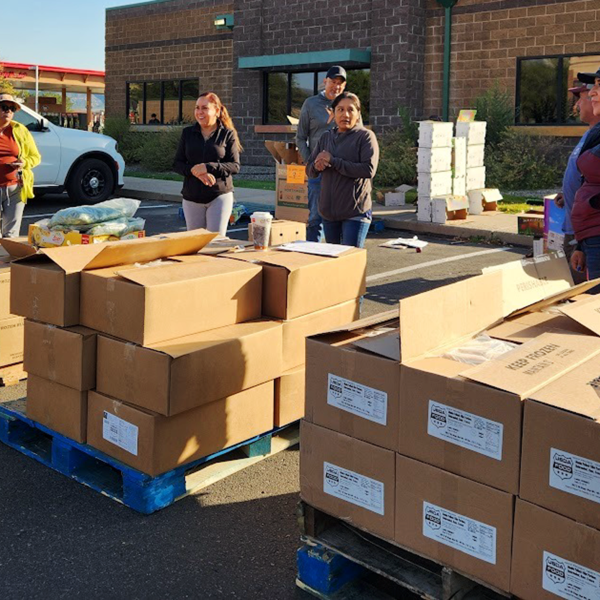
Policy and its consequences. The state and federal governments rushed food aid to people in need when the pandemic hit in early 2020. Congress increased Supplemental Nutrition Assistance Program (SNAP) benefits, and Colorado made school lunch free for all, even during the summer. However, Congress let extra SNAP benefits expire in February 2023. Colorado voters approved a tax to fund free school meals for all, and the program took effect in the 2023-24 school year.
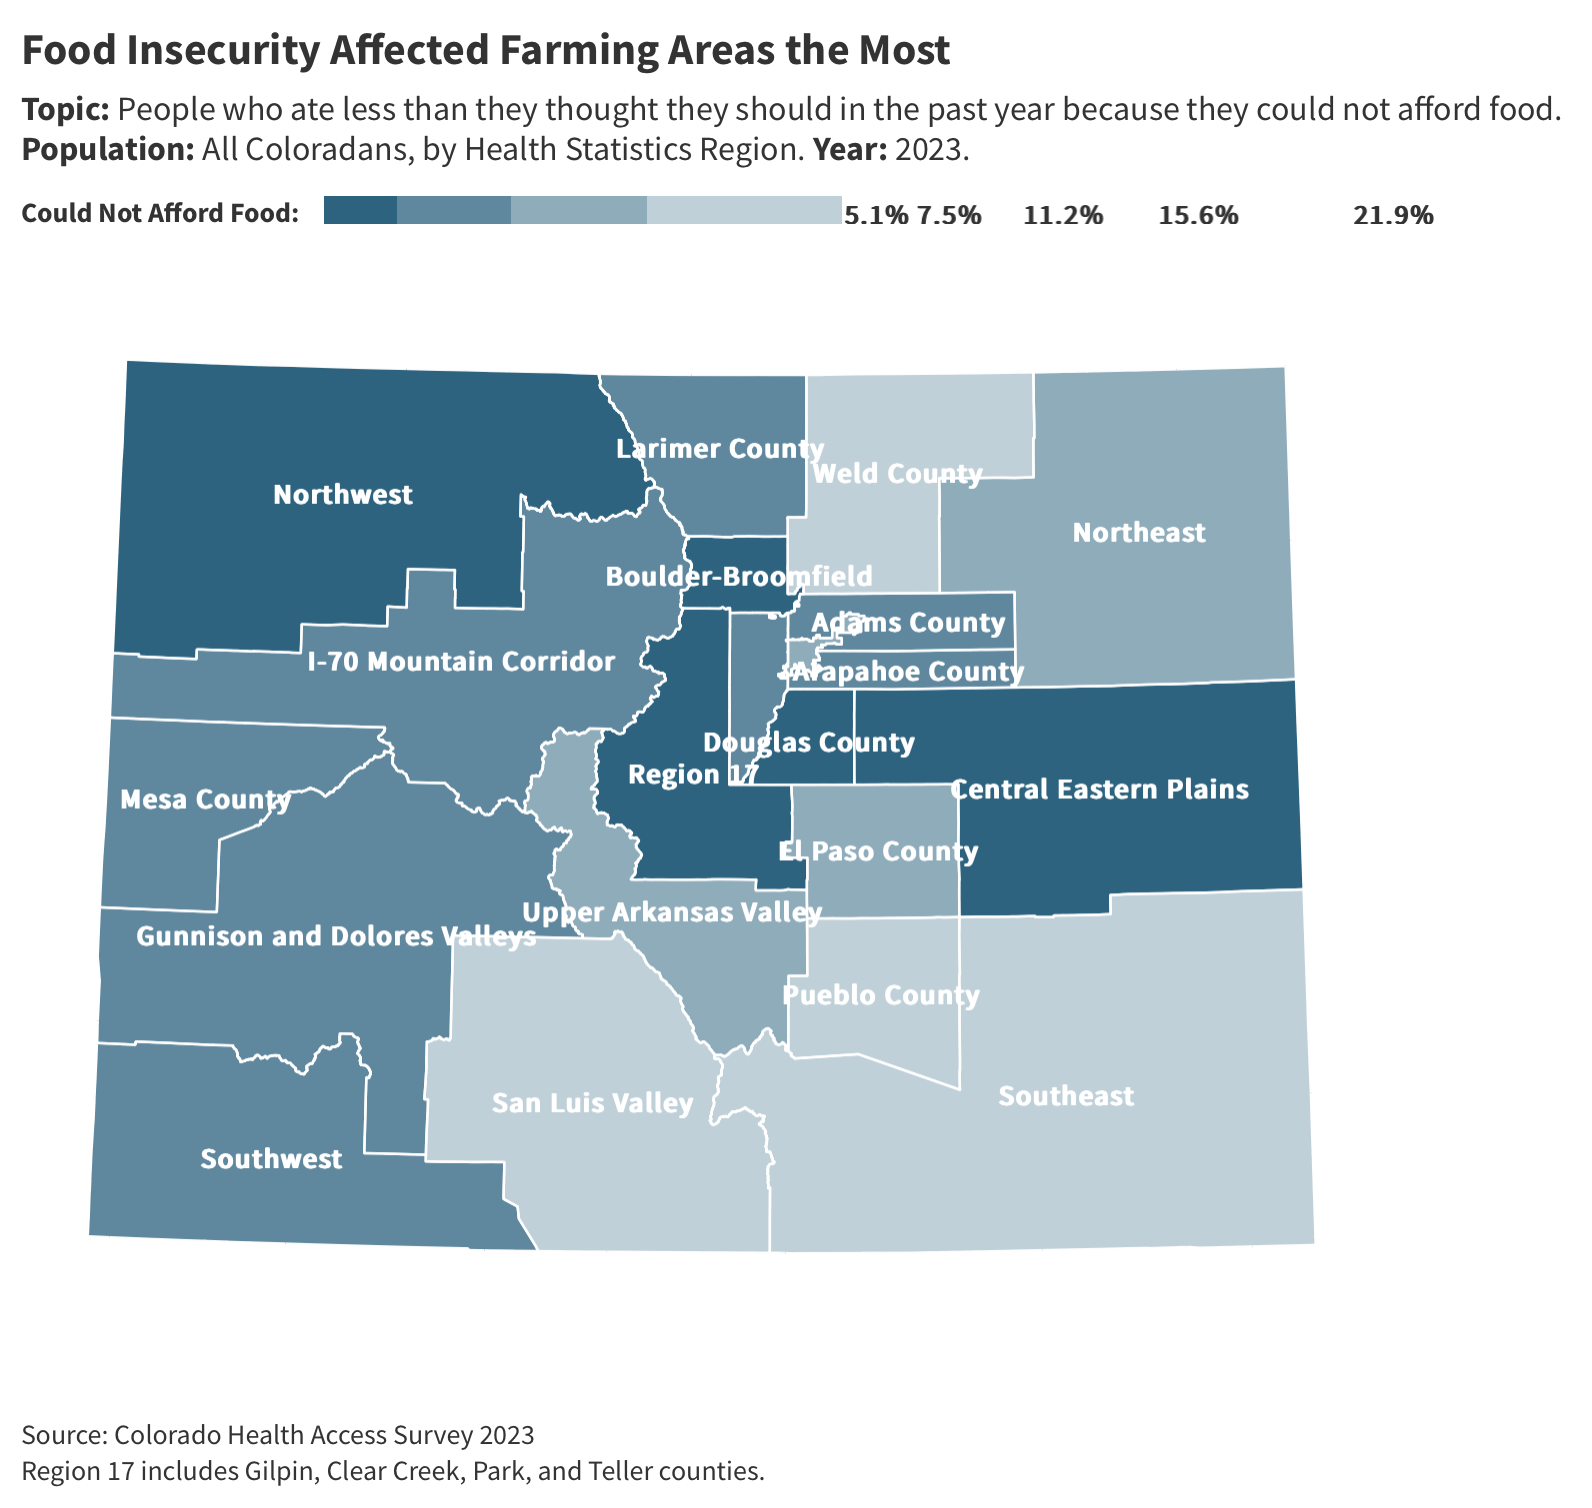
Hunger in farm country. People working in farming and ranching communities often aren’t getting enough to eat. The San Luis Valley, southeast Colorado, and Weld County all had some of the highest rates of food insecurity. Agriculture is the center of the economy in these areas.
Denver, Pueblo, and El Paso counties also had above-average rates of food insecurity.
Disparities. The survey showed sex and gender disparities, with 9.1% of males saying they couldn’t afford enough food at some point in the past year, compared with 12.2% of females. People who identified as nonbinary or another gender had an even higher reported rate, at 18.2%.
Food insecurity follows familiar race and ethnic patterns. Coloradans who are Black or Hispanic were twice as likely as white Coloradans to report food insecurity. See CHI's Statement on Health Disparities for reasons for these differences.
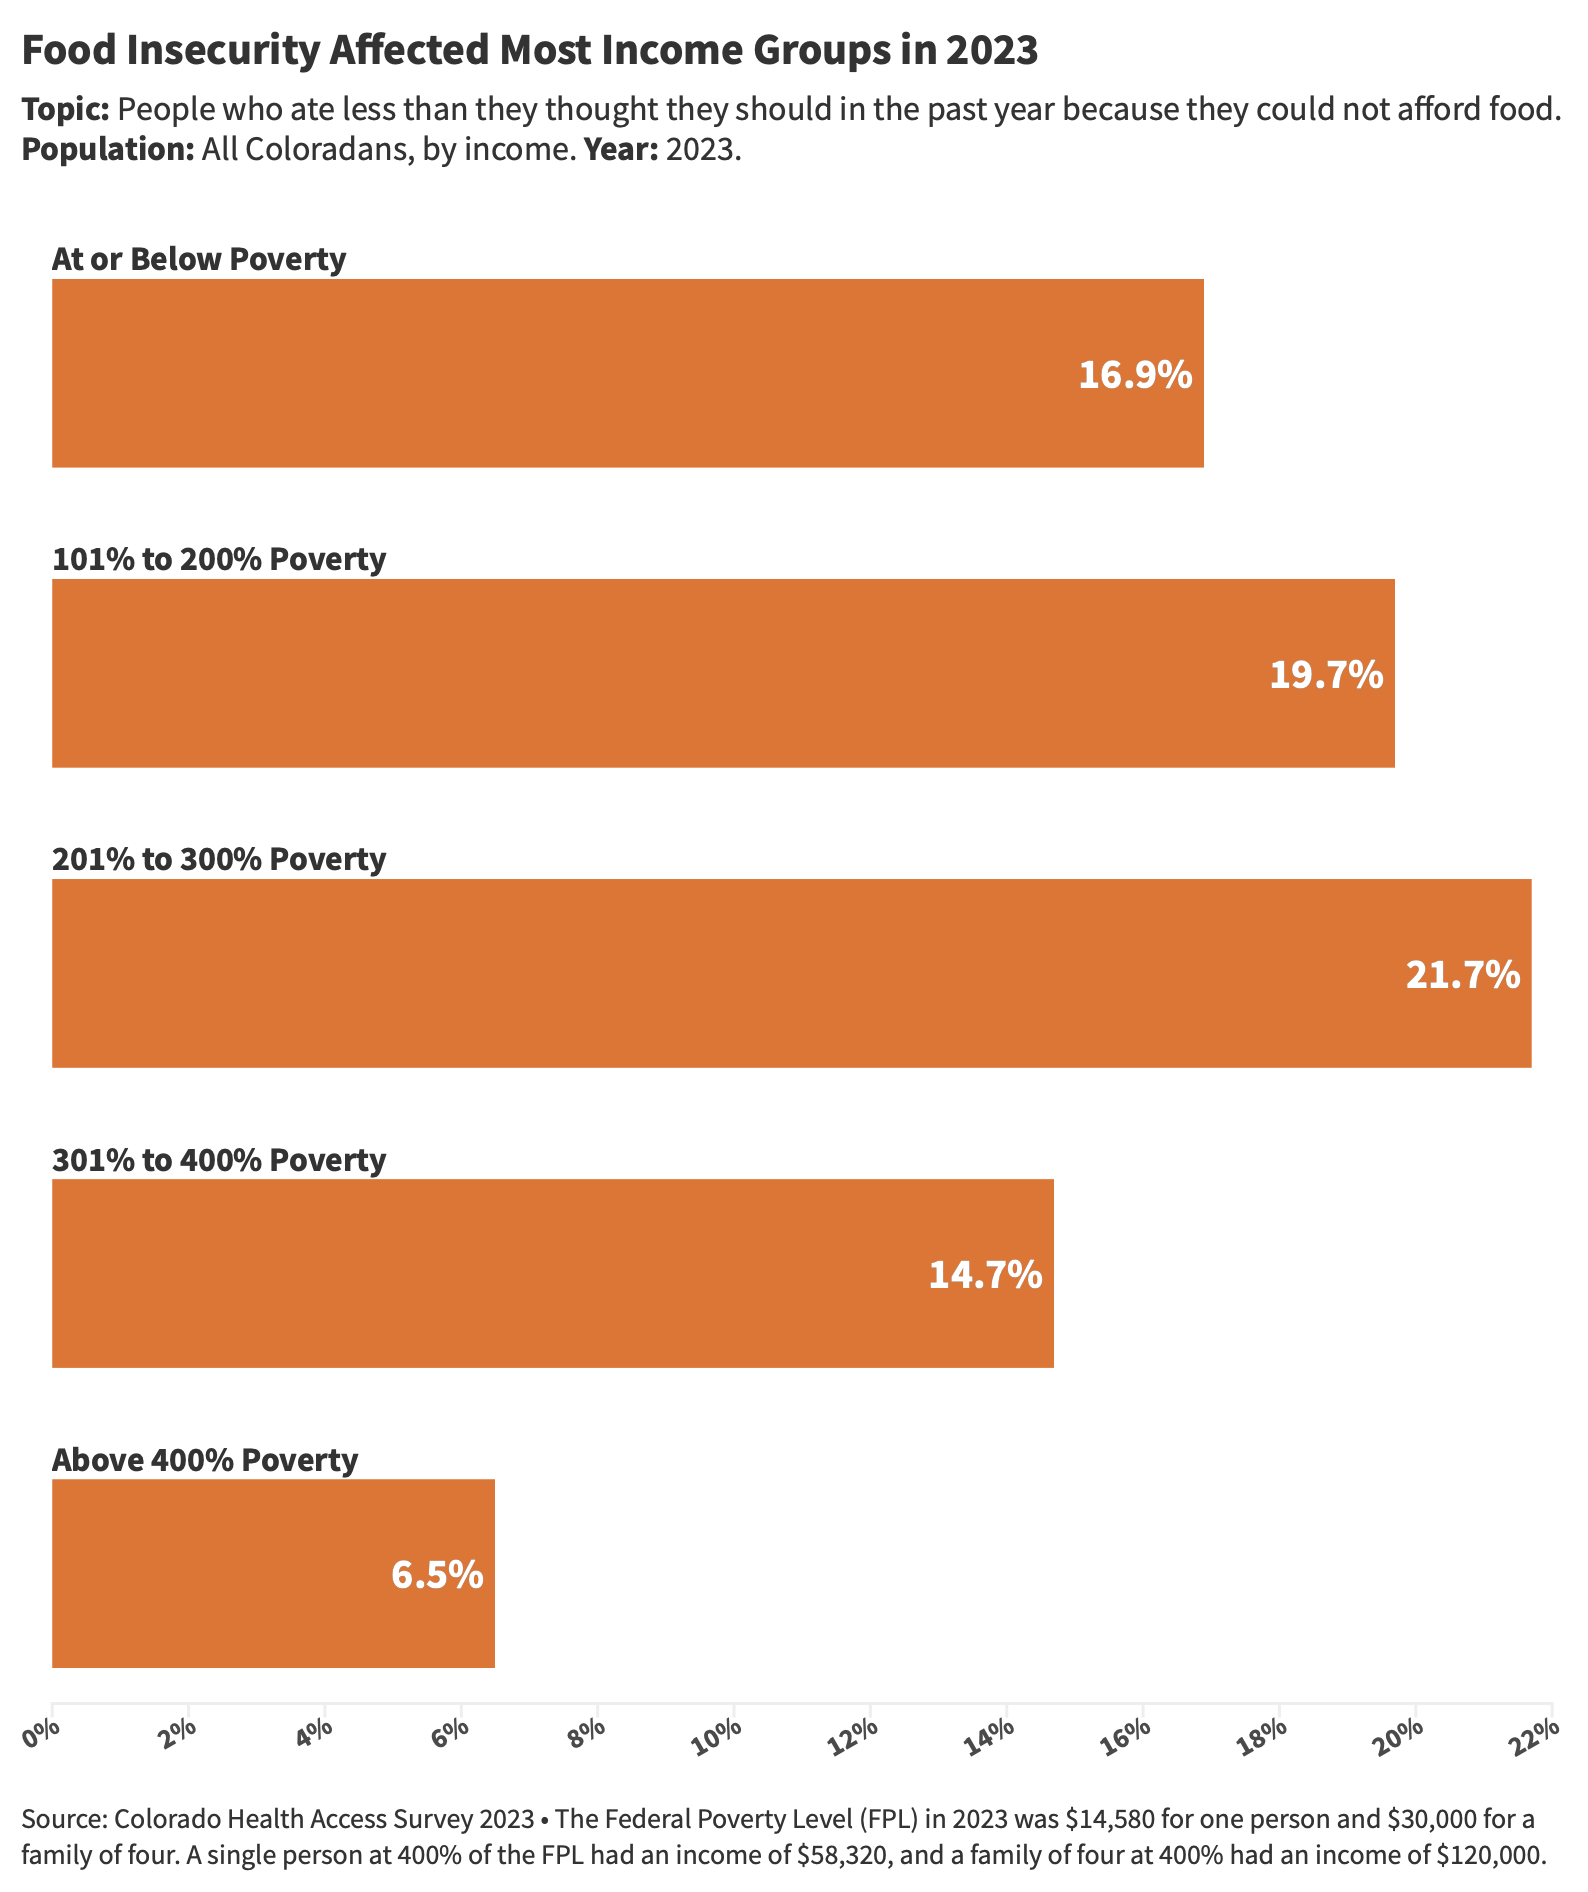
Income. Food insecurity is not merely a problem of poverty. The income group with the most food insecurity (21.7%) makes two to three times the official federal poverty level. That’s $60,000 to $90,000 for a family of four.
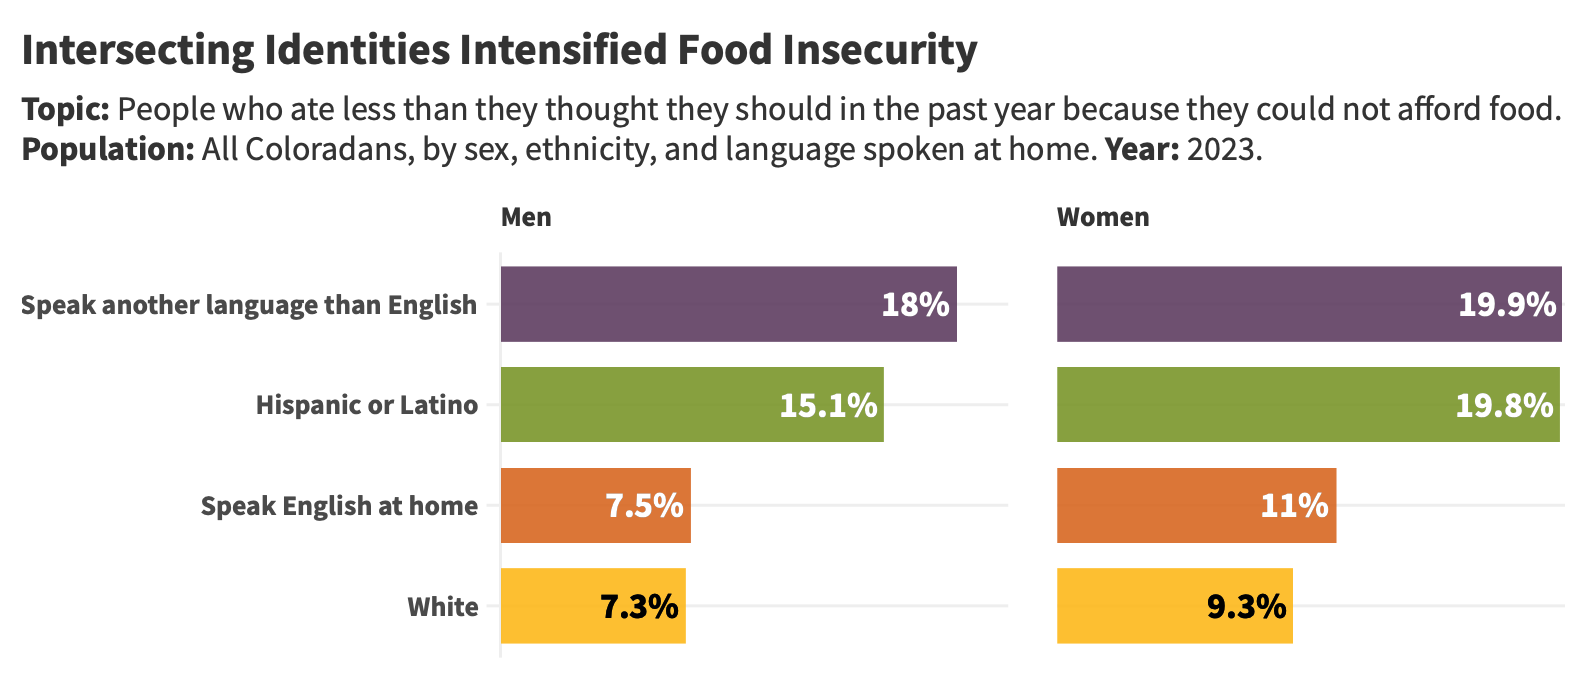
Intersecting identities. The burden of food affordability can look different for people of color who fall within other demographic characteristics that have a higher percentage of food affordability issues, such as those who speak a language other than English. For example, women and men were more likely to be food insecure if they speak a language other than English at home. This intersection of identities can culminate into very different experiences food insecurity.