Adequate health insurance. Plenty of providers. Regular checkups. Affordable medication.
The Colorado Health Institute’s third biennial Access to Care Index measures these and other factors to determine whether Coloradans can obtain the care they need — a crucial component for a lifetime of good health.
Insurance coverage in Colorado has reached historic highs since the launch of major Affordable Care Act (ACA) reforms in 2014. With 93.5 percent of Coloradans now covered, many policymakers and community health leaders have turned their attention to improving access to health care. The Access to Care Index provides data to support those efforts.
The 2017 average statewide index of 8.0 on a 10-point scale is unchanged from 2015, is a slight improvement from 2013, the year before the ACA’s major provisions went into effect.
However, all is not equal across Colorado. 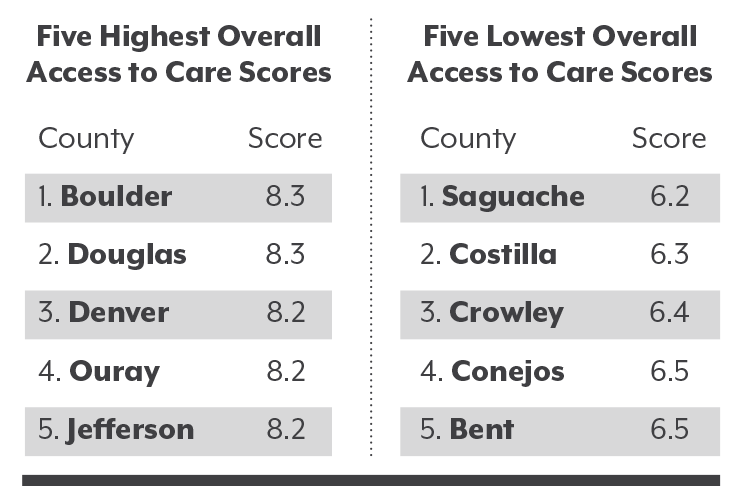
Boulder and Douglas counties tie for the highest access score at 8.3. Saguache County in the San Luis Valley has the lowest score of 6.2.
The index also measures access to care by income and race/ethnicity. Hispanic Coloradans report an access score of 8.1 compared with 8.5 for white (non-Hispanic) residents. And despite the ACA’s Medicaid expansion, lower-income Coloradans have an access to care score of 8.1 compared with 8.7 for higher-income groups.
How should the findings from the 2017 Access to Care Index be interpreted?
The answer is two ways: as a glass half-full and a glass half-empty.
Concerns that the ACA’s coverage expansions would overwhelm the medical system did not come to pass. In general, measures of access to care did not diminish between 2015 and 2017 in the wake of Medicaid expansion, arguably the most far-reaching health policy change of a generation. An estimated 600,000 more Coloradans had health insurance in 2017 than in 2013, the year before the state expanded Medicaid eligibility.
On the other hand, Colorado has not seen an increase in use of health care, especially preventive care, which might have been expected with the rise in the number of insured Coloradans. In fact, the score for the Realized Access portion of the index declined a bit between 2015 and 2017. This indicates that use of needed services has yet to catch up with increases in coverage, suggesting that educating Coloradans about how to navigate the system or the value of preventive care may need additional attention.
Click here to watch a recording of our May 10, 2018, webinar.
Click here to download our Access to Care Index PowerPoint presentation.
Access to Care: The Interactive Dashboard
The Colorado Health Institute’s 2017 Access to Care Index has several new features, including data at the county level rather than the regional level; additional factors related to access to care; and an interactive online dashboard. (Explore the Tableau dashboard below.)
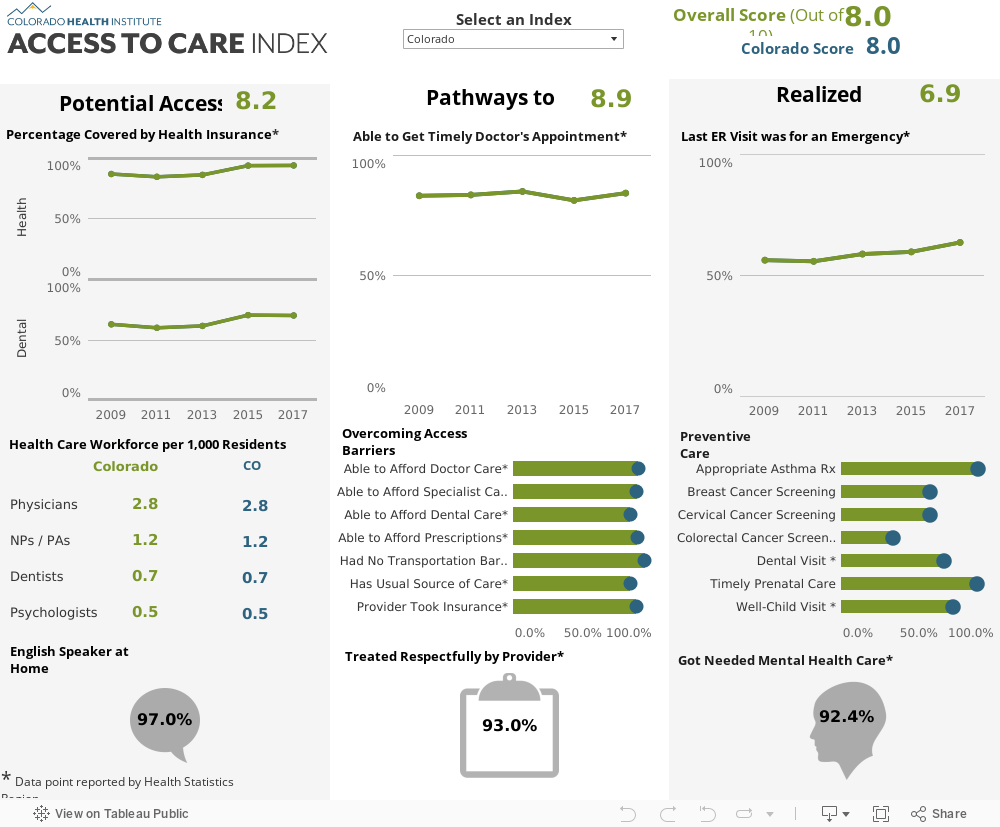
Each county, income group, and race/ethnicity group has an overall access to care score, which is based on three categories: Potential Access, Pathways to Care and Realized Access. In total, we measured 25 factors across these categories.
Potential Access
This category focuses on the building blocks of access to care. It measures whether the infrastructure exists to ensure people get the care they need. The seven factors we chose include health and dental insurance coverage; the adequacy of the health care workforce measured by the number of health care providers per 1,000 residents; and the percentage of families with at least one fluent English speaker at home, a proxy for how language proficiency can affect care. Potential Access scores have increased in recent years, rising to 8.2 in 2017 from 8.0 in 2015 and 7.7 in 2013.
Pathways to Care
Even when there is sufficient infrastructure to help people get care, obstacles can remain. The Pathways to Care category looks at these barriers to care. The nine factors include the affordability of care, transportation difficulties, and timely treatment by providers. Unlike Potential Access, pathways scores have shown little change. The 2017 score is 8.9 compared with 8.8 in both 2015 and 2013.
Realized Access
This category measures whether a person saw a provider and got appropriate care. It examines how well Potential Access and Pathways to Care have translated into the actual use of health care services. The nine factors include appropriate use of the emergency room, regular dental visits and cancer screenings. The 2017 Realized Access score is 6.9, down from 7.0 in 2015 but up from 6.8 in 2013.
2017 Findings
The Access to Care Index shows that Colorado scored 8.0 of 10 possible points in 2017. This is unchanged from 2015, but a slight improvement from 2013, when the state score was 7.8.
In general, urban Front Range counties have better access to health care than rural areas. Counties in the Denver metro area score the highest, with Boulder and Douglas counties at 8.3 and Denver a close third at 8.2.
The state’s lowest access to care scores are found in the southern part of the state, often in the San Luis Valley. Saguache County has a score of 6.2, Costilla County, 6.3; Crowley County, 6.4; and Conejos County, 6.5. (See Map 1.)
Counties in northwestern Colorado and on the Eastern Plains have shown some of the greatest improvements in recent years. (See Map 2.)
In the mountains, Jackson County’s score climbed more than 13 percent since 2013, and Gilpin, Moffat and Routt counties grew by six percent. In the east, Kit Carson County also had a six percent improvement, and Baca County’s score grew by five percent. Other counties with large improvements were Rio Blanco and Teller counties, both with five percent gains.
Where you live isn’t the only factor that influences access to care.
Lower-income Coloradans, those with annual earnings below 139 percent of the federal poverty level, have an access to care score of 8.1 compared with 8.7 for Coloradans with annual incomes at least four times the federal poverty level. However, those lower-income Coloradans, most of whom qualify for Medicaid, have seen their access to care improve in recent years, with scores moving from 7.7 to 8.1. The access of higherincome Coloradans remained steady at 8.7.
There are also some differences by race and ethnicity, though the inequities are narrower than income disparities. Non-Hispanic white Coloradans score 8.5 on the index compared with 8.1 for Hispanic Coloradans. This is mostly driven by differences in the Realized Access category, including rates of prenatal care, dental care and well-child visits.
Conclusion
With a record-high 93.5 percent of Coloradans insured, there is a growing focus on how this translates into access to care. CHI’s 2017 Access to Care Index shows modest improvements since 2013.
Coloradans are often covered by health plans with high deductibles, creating cost barriers to accessing care despite having insurance. And communities across the state continue to face problems beyond the reach of coverage expansion, such as workforce shortages and transportation challenges.
Policies aiming to move the needle on access to health care will have to address these remaining issues on accessibility and cost. The 2017 Access to Care Index can help communities identify and understand these ongoing challenges.


